Programming Blog
Terminal Commands for Big Data Workflows & GitHub
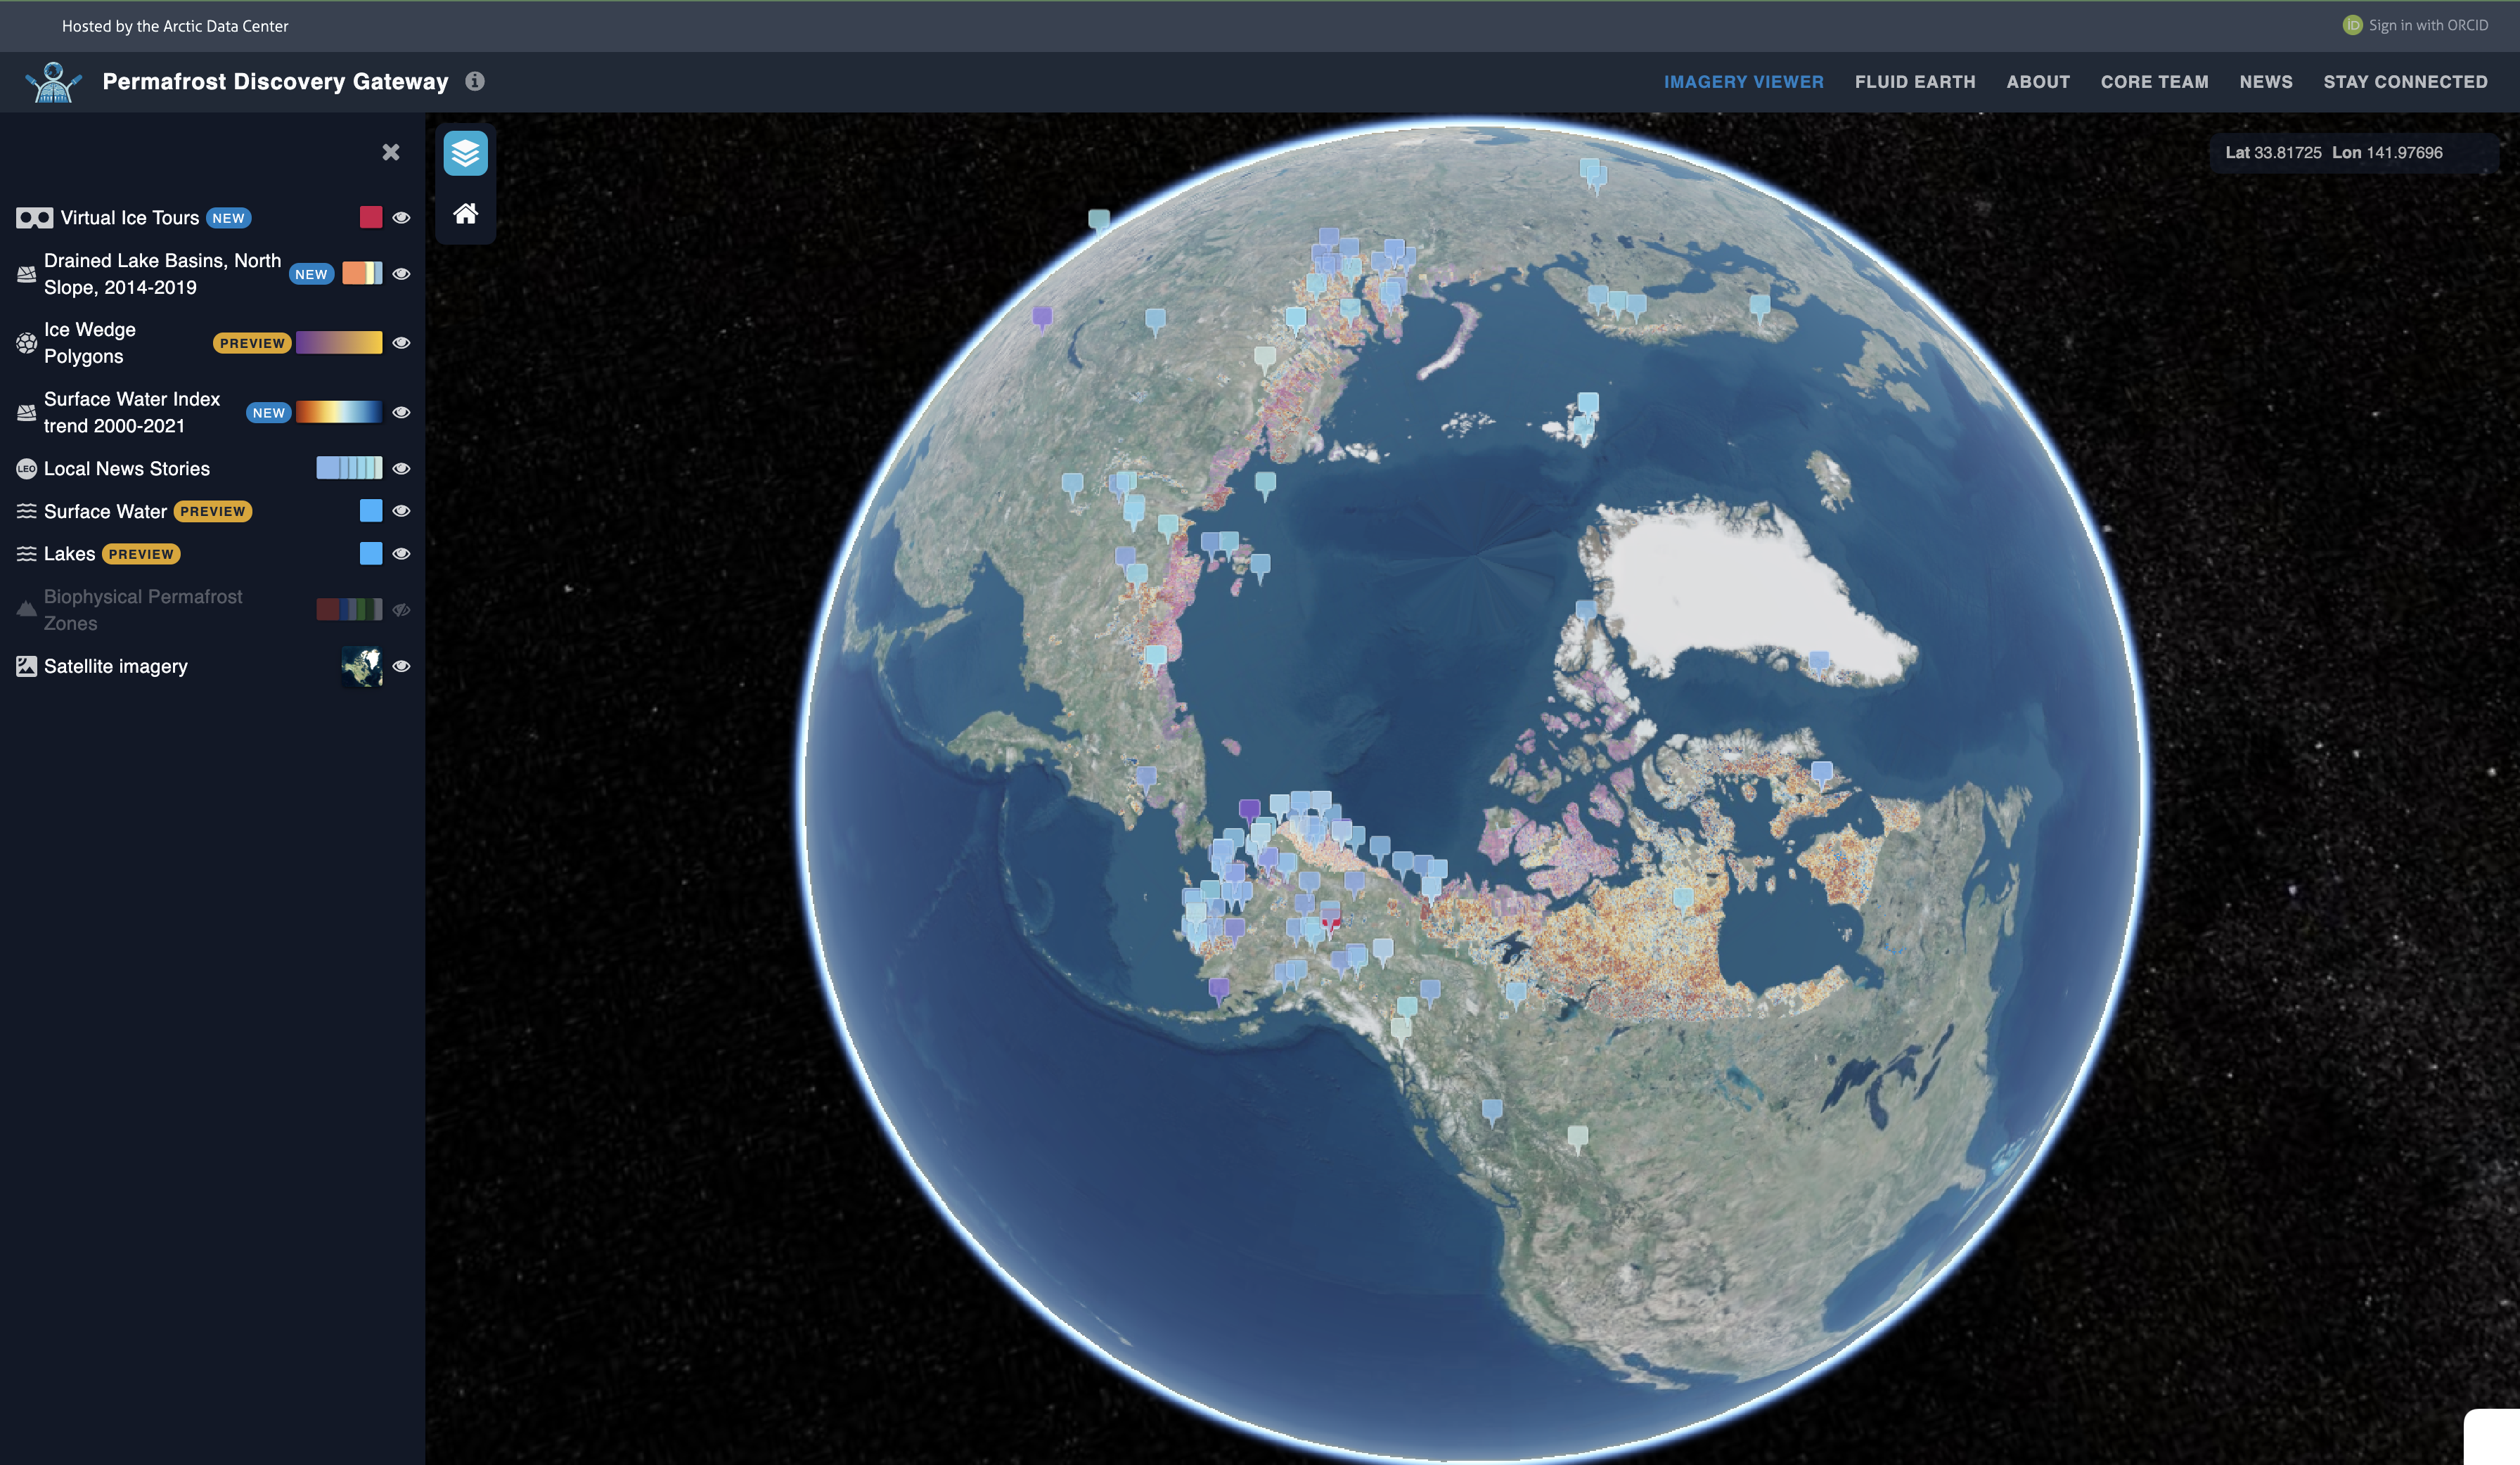
Whether you're processing large datsets on remote servers or fixing bugs in a branch, command line skills are essential for working efficiently. Check out the commands that I've found to be useful for processing terabytes of Arctic data for visualization on the Permafrost Discovery Gateway.
Spatial Data in R: Converting from raster to terra
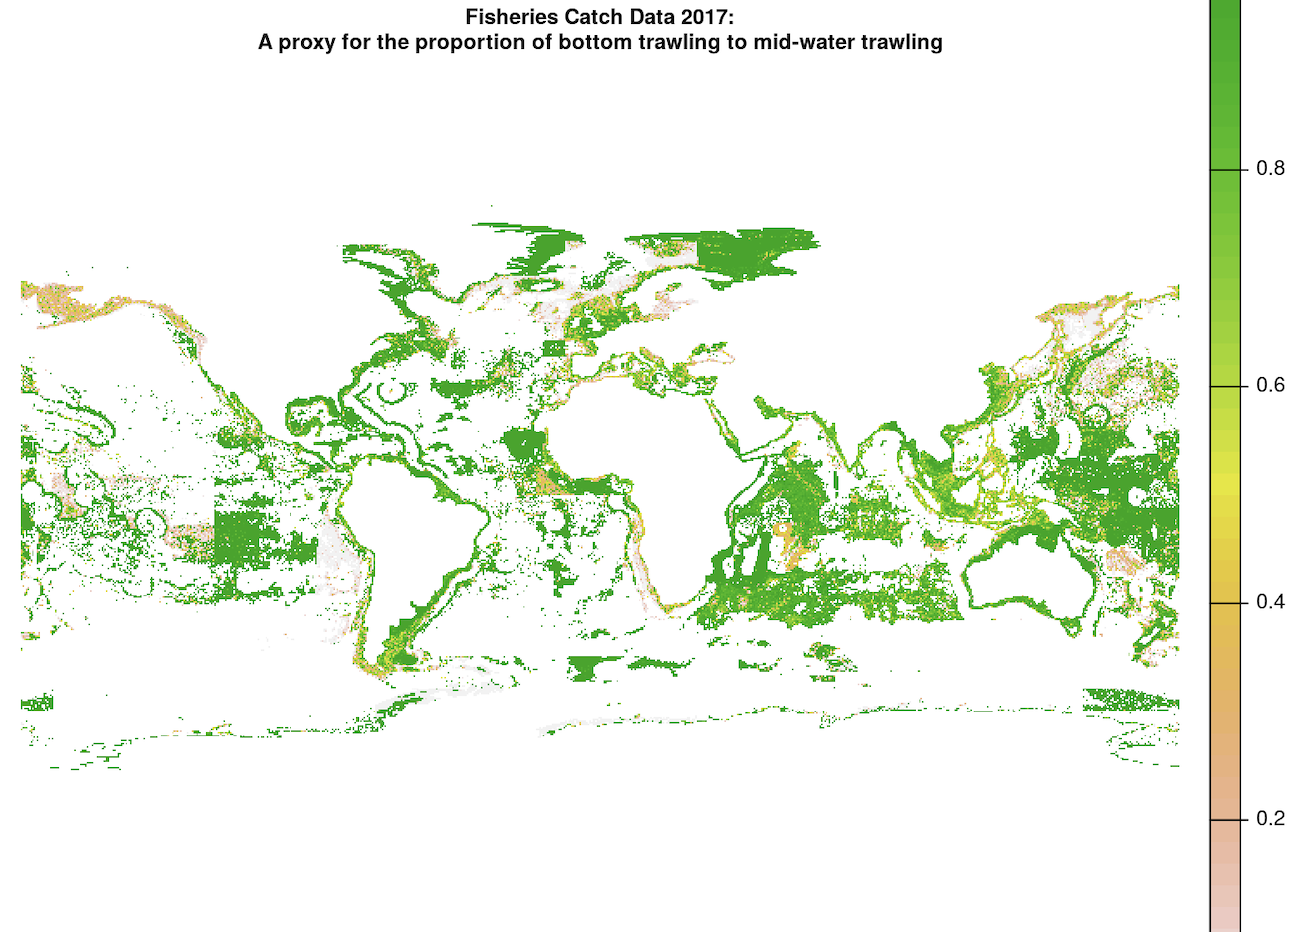
Raster has been the go-to spatial analysis package in R since the dawn of time, but it's time for the Ocean Health Index to convert our workflow to the more modern terra package. We work with spatial data for a plethora of landscapes, such as mapping sea ice extent and coastal mangroves that sequester carbon. As we map the soft bottom habitat destruction across the globe, let's dive into how we converted our raster workflow to terra.
Ethics and Bias in a Zambia Case Study
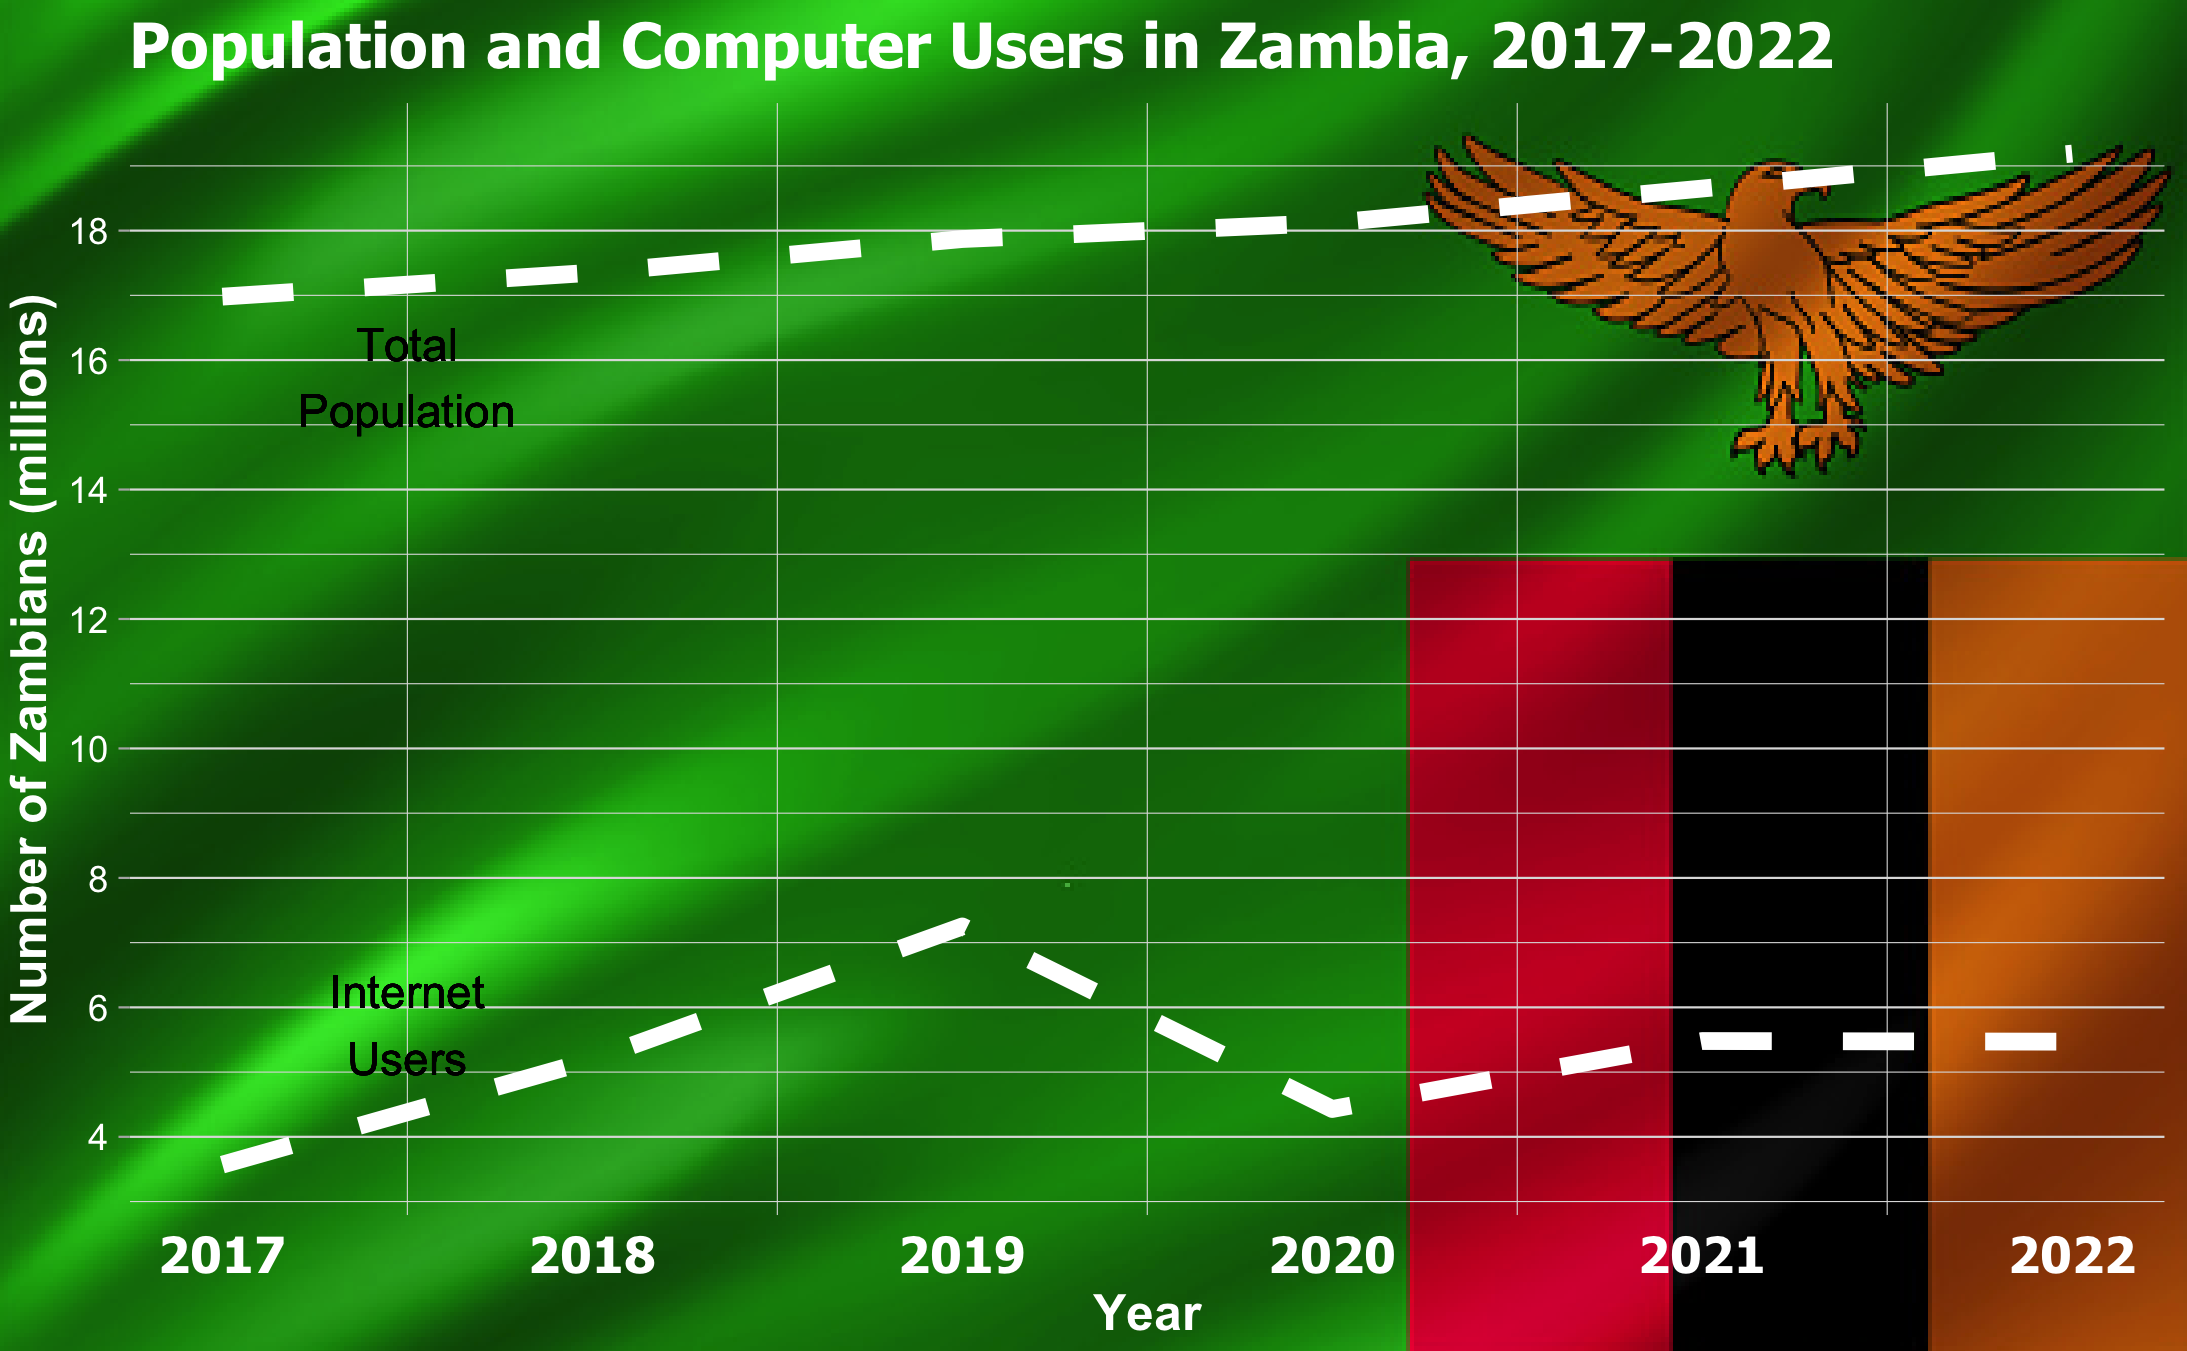
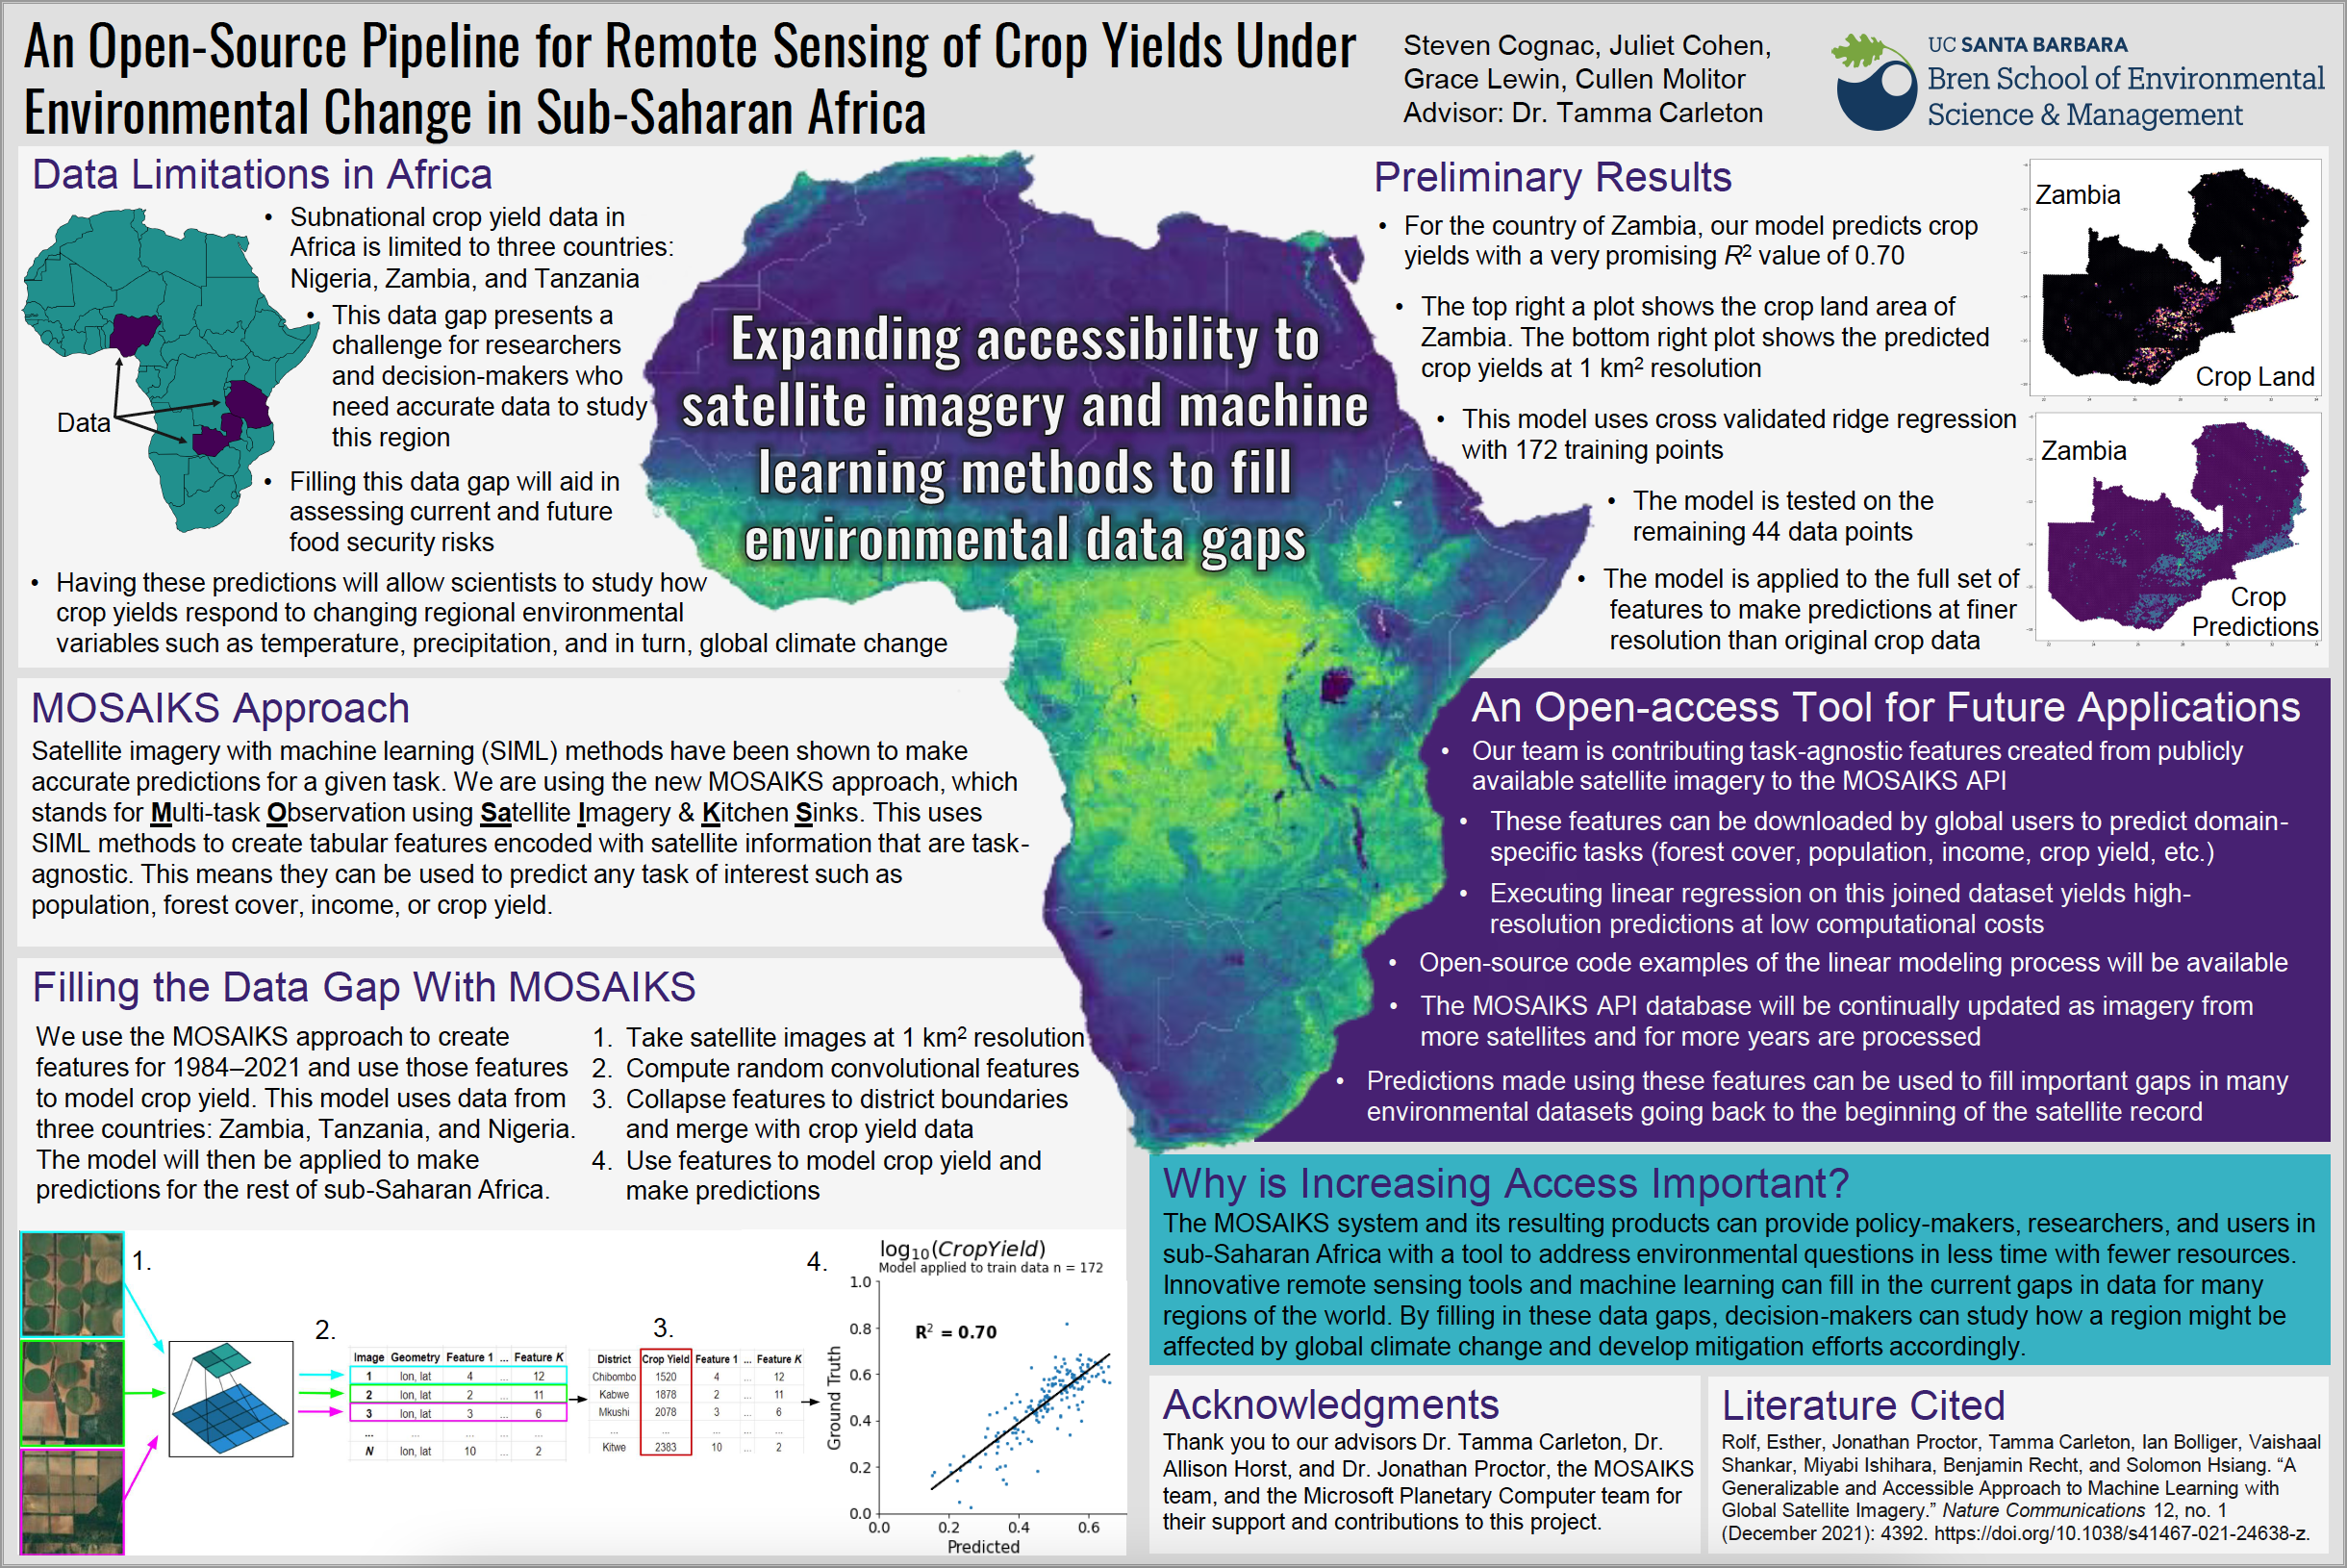
Modern remote sensing techniques combined with machine learning can help us better understand agriculture across the globe and serve as a tool to predict future trends. Within the context of predicting maize yields in Zambia, we should consider the ethics and bias embedded in producing a reproducible pipeline using Zambian data that may not be accessible to many people in Zambia.
Whale Habitat & Vessel Collisions in the Caribbean
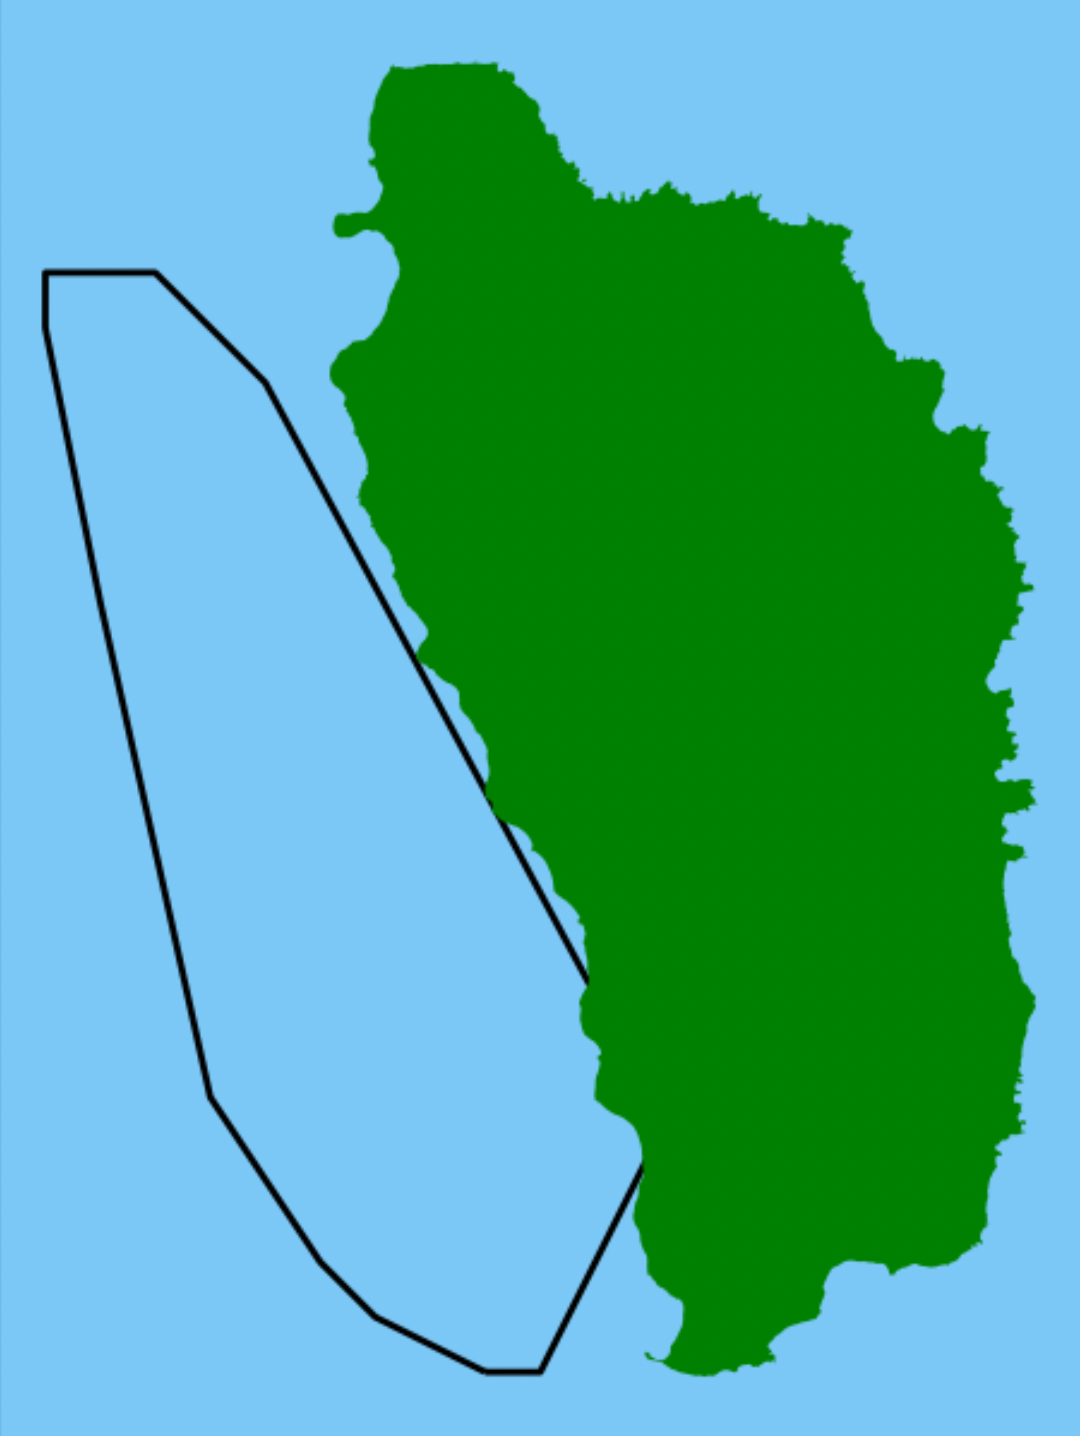
Whales migrate and raise their young in seascapes that are heavily utilized for cargo transport, ecotourism, and fishing. Perhaps reducing vessel speed in these whale-inhabited zones will reduce ship-whale collisions. Using spatial tools in Python, we investigate the overlap of these two components and calculate the increase in vessel commute time in a hypothetically enforced speed reduction zone.
New Horizons in Conservation Conference 2022 - Yale School of the Environment
Using remote sensing tools to predict crop yield in sub-Saharan Africa
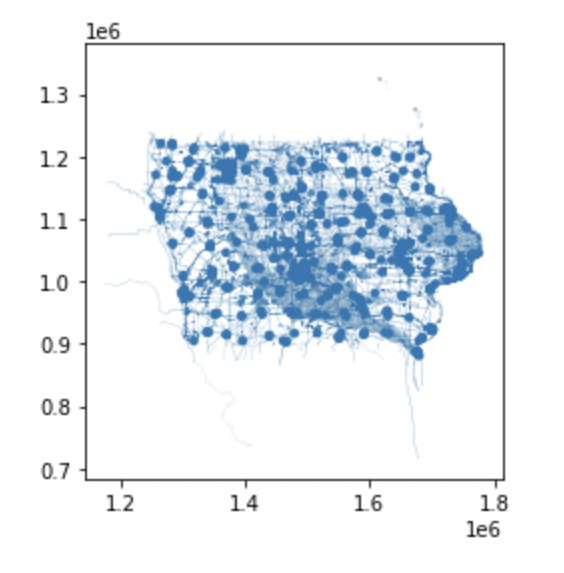
Using SQL & Python to Calculate Iowa's Wind Power Potential
How many wind turbines can we legally fit into the state of Iowa, and how much renewable energy would that yield?
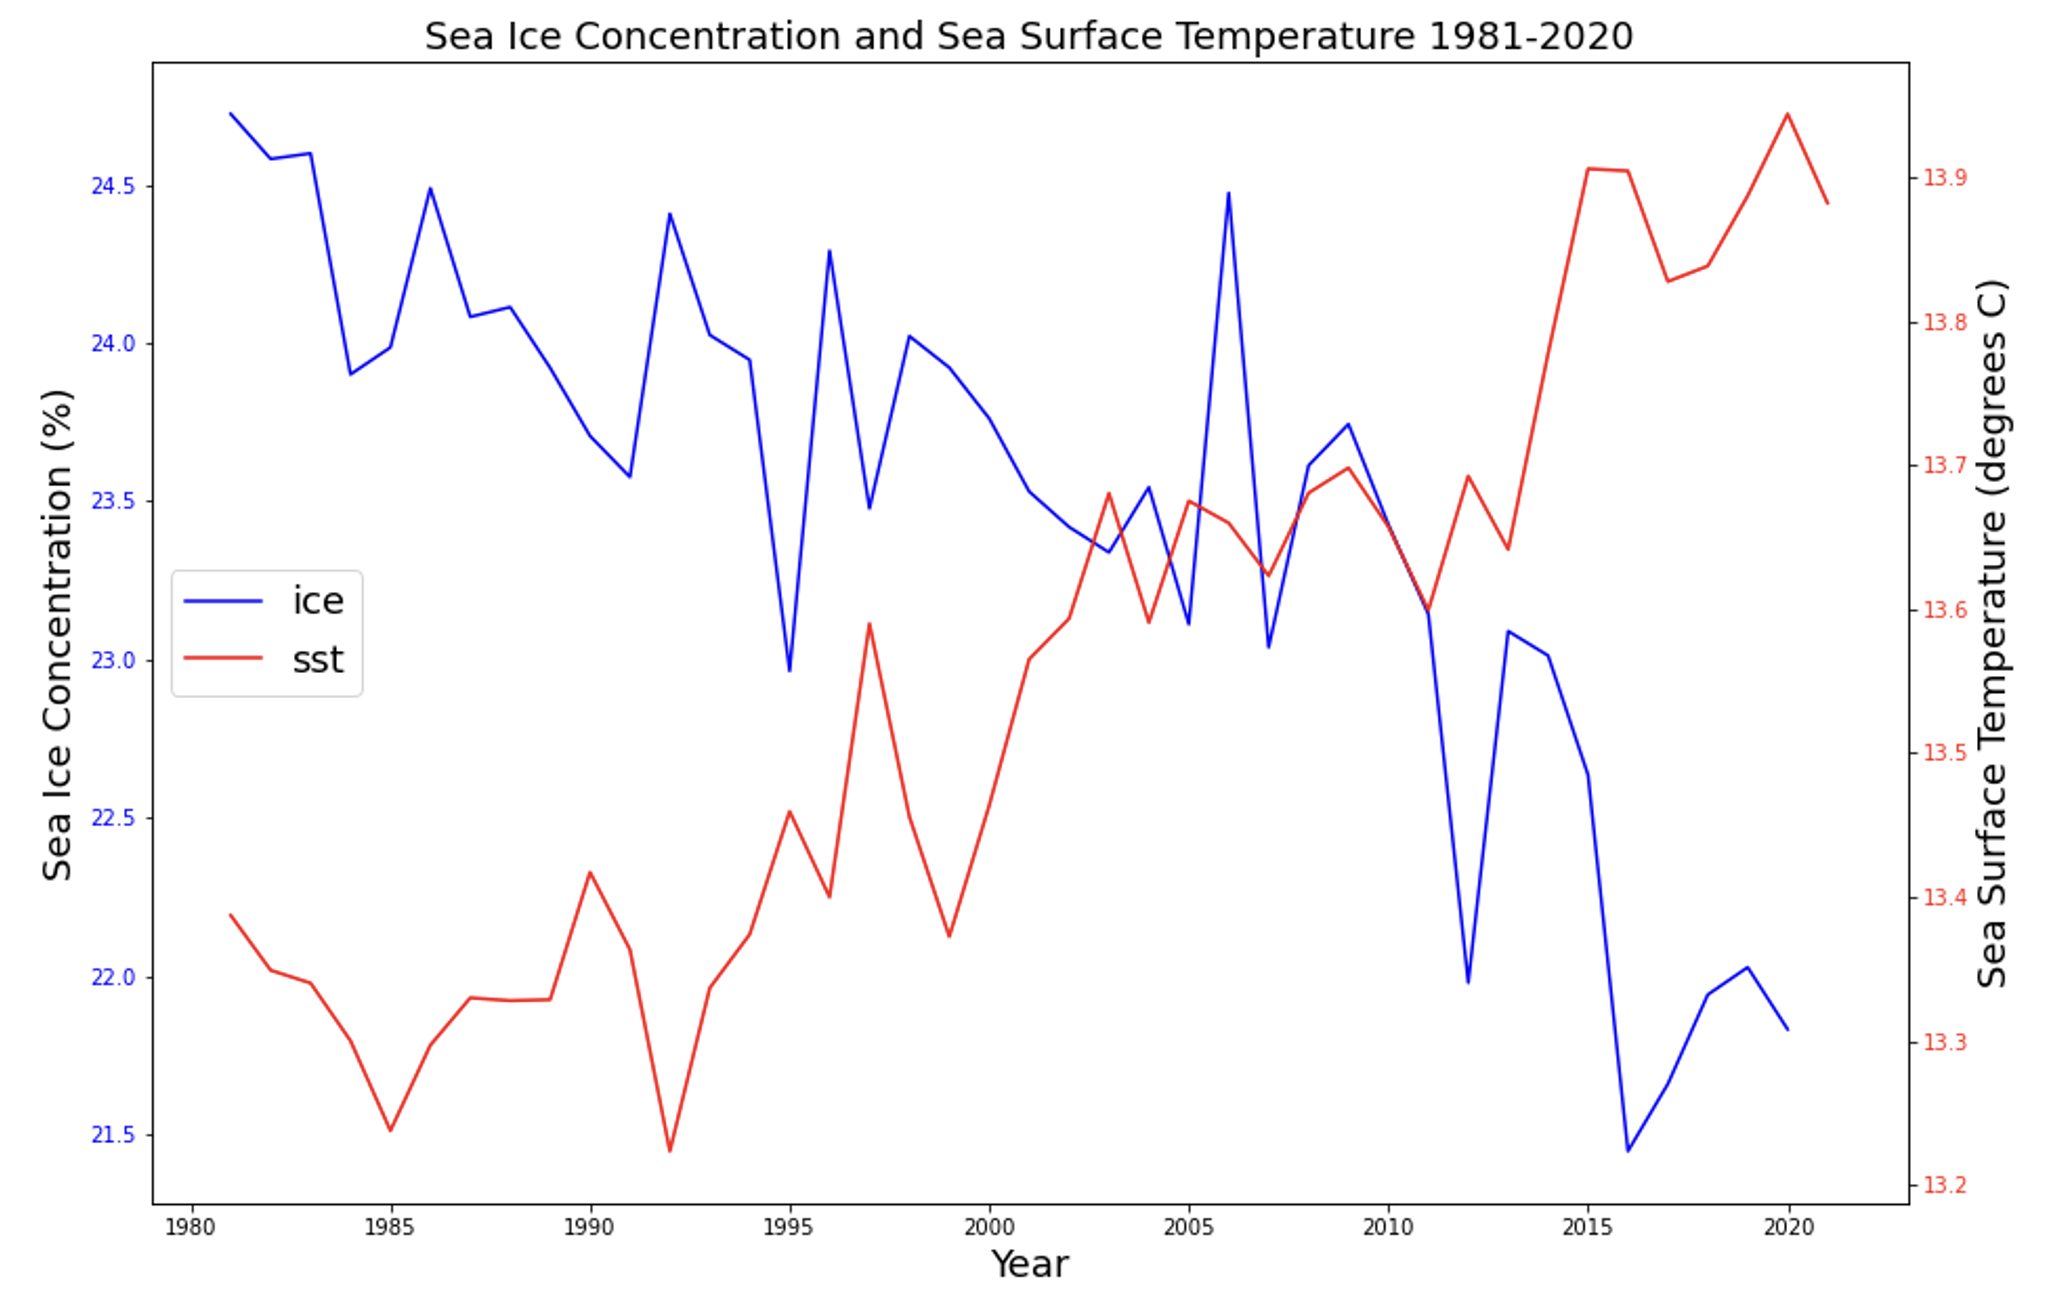
Plotting Sea Surface Temperature and Sea Ice Concentration Over Time in Python
Using satellite data from the National Oceanic and Atmospheric Administration to detect global trends in sea surface temperature and sea ice concentration from 1981-2021.
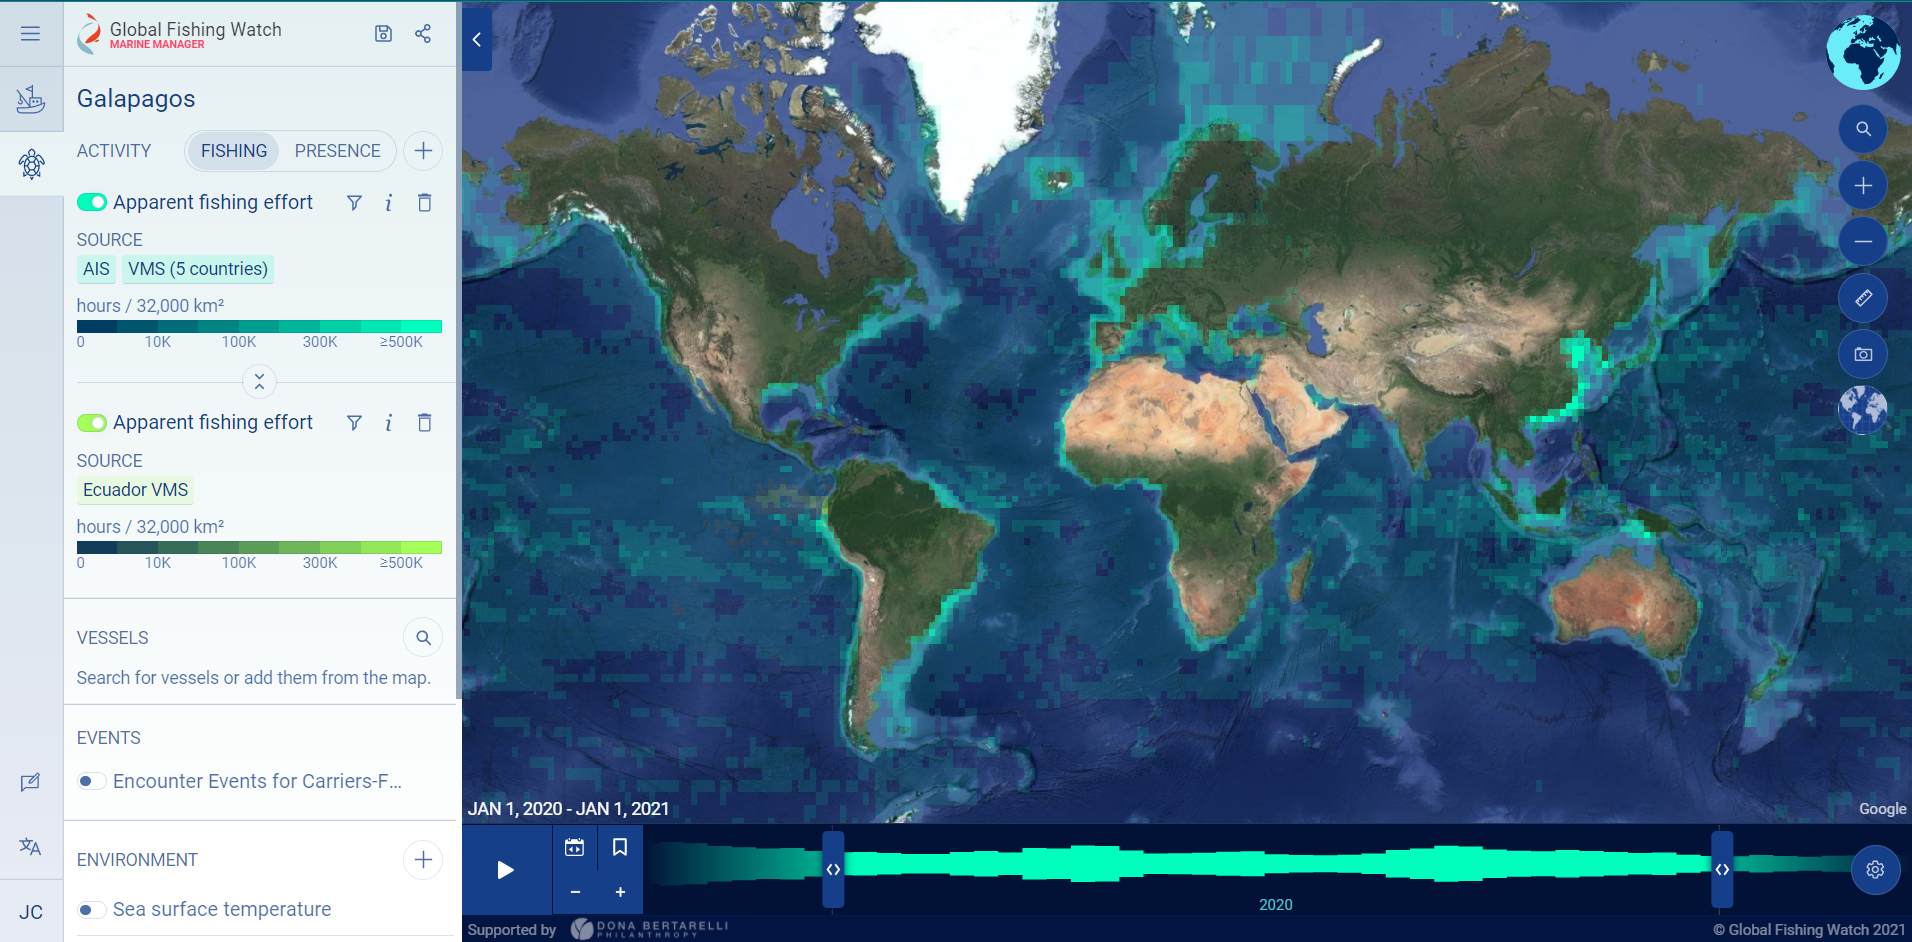
Global Fishing Effort & Covid-19: A Statistical Analysis
A statistical approach to answer the question: How did Covid-19 impact global fishing efforts in 2020?

Plotting Shapefiles on a Basemap in Python: endangered species habitat
The basics for reading in shapefile data, plotting it, and adding a basemap.
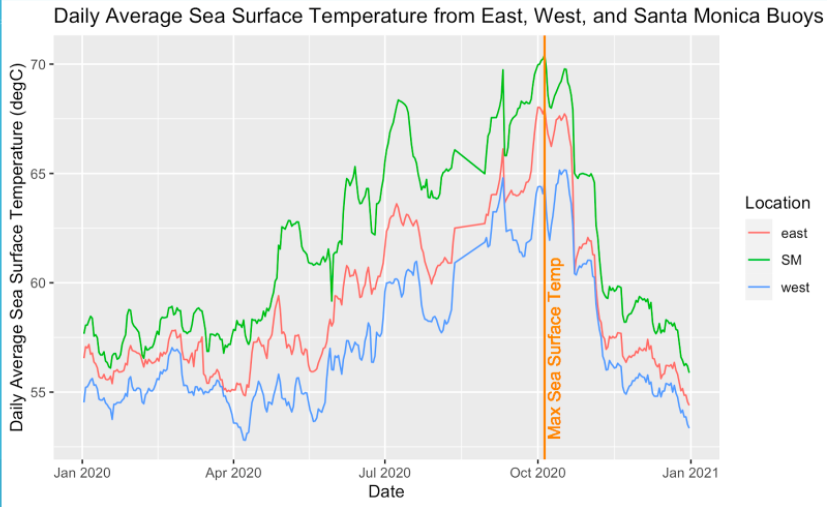
Using an API to visualize environmental conditions in the Santa Barbara Channel
Interpretting marine processes by combining data sets of sea surface temperature, chlorophyll, and wind.
Tidy data and the case_when() function in R
A gem within the expansive tidyverse.