How did global fishing activity change during the Covid-19 pandemic?
2020 is a year the world will never forget. Covid-19 spread rapidly across the globe and forced most of humanity into a state of quarantine. The pandemic had clear devastating impacts on economies of all scales. On the other hand, the pandemic boosted some sectors of the economy and increased demand for certain goods. How did Covid-19 impact the global fishing economy? Did fisheries respond to the pandemic by sending fishermen and fisherwomen home to quarantine, and instead allocate resources towards public health initiatives? Alternatively, did some countries see this as an opportunity to fish unregulated in the high seas more than ever before? There is very limited literature that addresses this question, which is likely due to the fact that 2020 was less than a year ago, and any formal scientific studies on this topic might not have had time to be published. Pita et al. 2021 assessed Covid-19’s impact on global marine recreational fisheries via a questionnaire, but this research differs from my statistical analysis in that it did not use vessel data or quantitatively calculate how fishing hours differed over time, and the study only includes 16 countries (5).
Regulating and documenting fishing activity and other vessel activities across the globe is a major challenge (4). Databases often have substantial gaps due to a lack of reliable data from automatic identification systems and voluntary vessel registration. Global Fishing Watch is an organization that aims to revolutionize the way we monitor fishing activity across the world using remote sensing techniques from satellites combined with automatic identification systems. Global Fishing Watch collects and visualizes global fishing data with the goal of embracing ocean sustainability, transparency, and open-source science. They keep track of vessels from all different countries, including their movements, boat types, and time stamps for fishing and docking at ports (9). Without such efforts to monitor, publicize, and regulate ocean activity, our marine resources are at high risk of depletion. On a global scale, we are fishing faster than fish stocks can naturally replenish. This has severe economic impacts; according to the World Bank Report, the ensuing depletion of marine fish stocks causes economic losses of 50 billion US dollars annually (4). With modern data science and applied statistics, we can better understand fishing activity on a global scale and protect our planet’s marine biodiversity.
As an aspiring wildlife biologist and data scientist, I’m interested in applying statistical analysis to Global Fishing Watch data data to learn how different countries’ fishing effort changed in 2020, relative to those countries’ fishing trends in the years leading up to 2020. In this dataset, fishing effort is defined by the amount of hours spent fishing (3). I chose to use this dataset for my statistical analysis because it is already relatively clean, and I know the data is reliable because Global Fishing Watch is a highly respected data resource with highly accurate remotely sensed data that is combined with locally collected automatic identification systems on shore. Furthermore, I am interested in working with Global Fishing Watch and spatial data in the future. This data does not have a spatial component since country is a categorical variable, and the temporal variable is limited to years. The only bias I believe might be present in this data is that it is limited to boats that either voluntarily allow their fishing hours to be tracked (such as through automatic identification systems) as well as boats that have been detected remotely by satellite. With Global Fishing Watch’s expansive open-source data collection, we can approach this question by grouping all vessels’ fishing hours by country, identifying a statistical trend up until 2019, and extrapolating that trend into 2020. By comparing this 2020 prediction to the actual fishing data available for 2020, we can glean how Covid-19 skewed large-scale fishing efforts. I chose this analysis approach because I am familiar with many of these processes through my graduate statistics course, and I believe it will be a simple and accurate way to derive a p-value that will reveal if there is a statistically significant difference between each country’s actual mean fishing effort and their predicted mean fishing effort in 2020. Perhaps the global fishing economy sky-rocketed, plummeted into near nonexistence, or remained unscathed by the pandemic. Quantitative analysis will help provide some insight.
Global Fishing Watch offers an interactive heat map that displays fishing activity across the globe. This visualization has the potential to inspire data scientists, fish enthusiasts, environmental justice advocates, pandemic researchers, and everyone in between to examine fishing activity during a time period of interest.
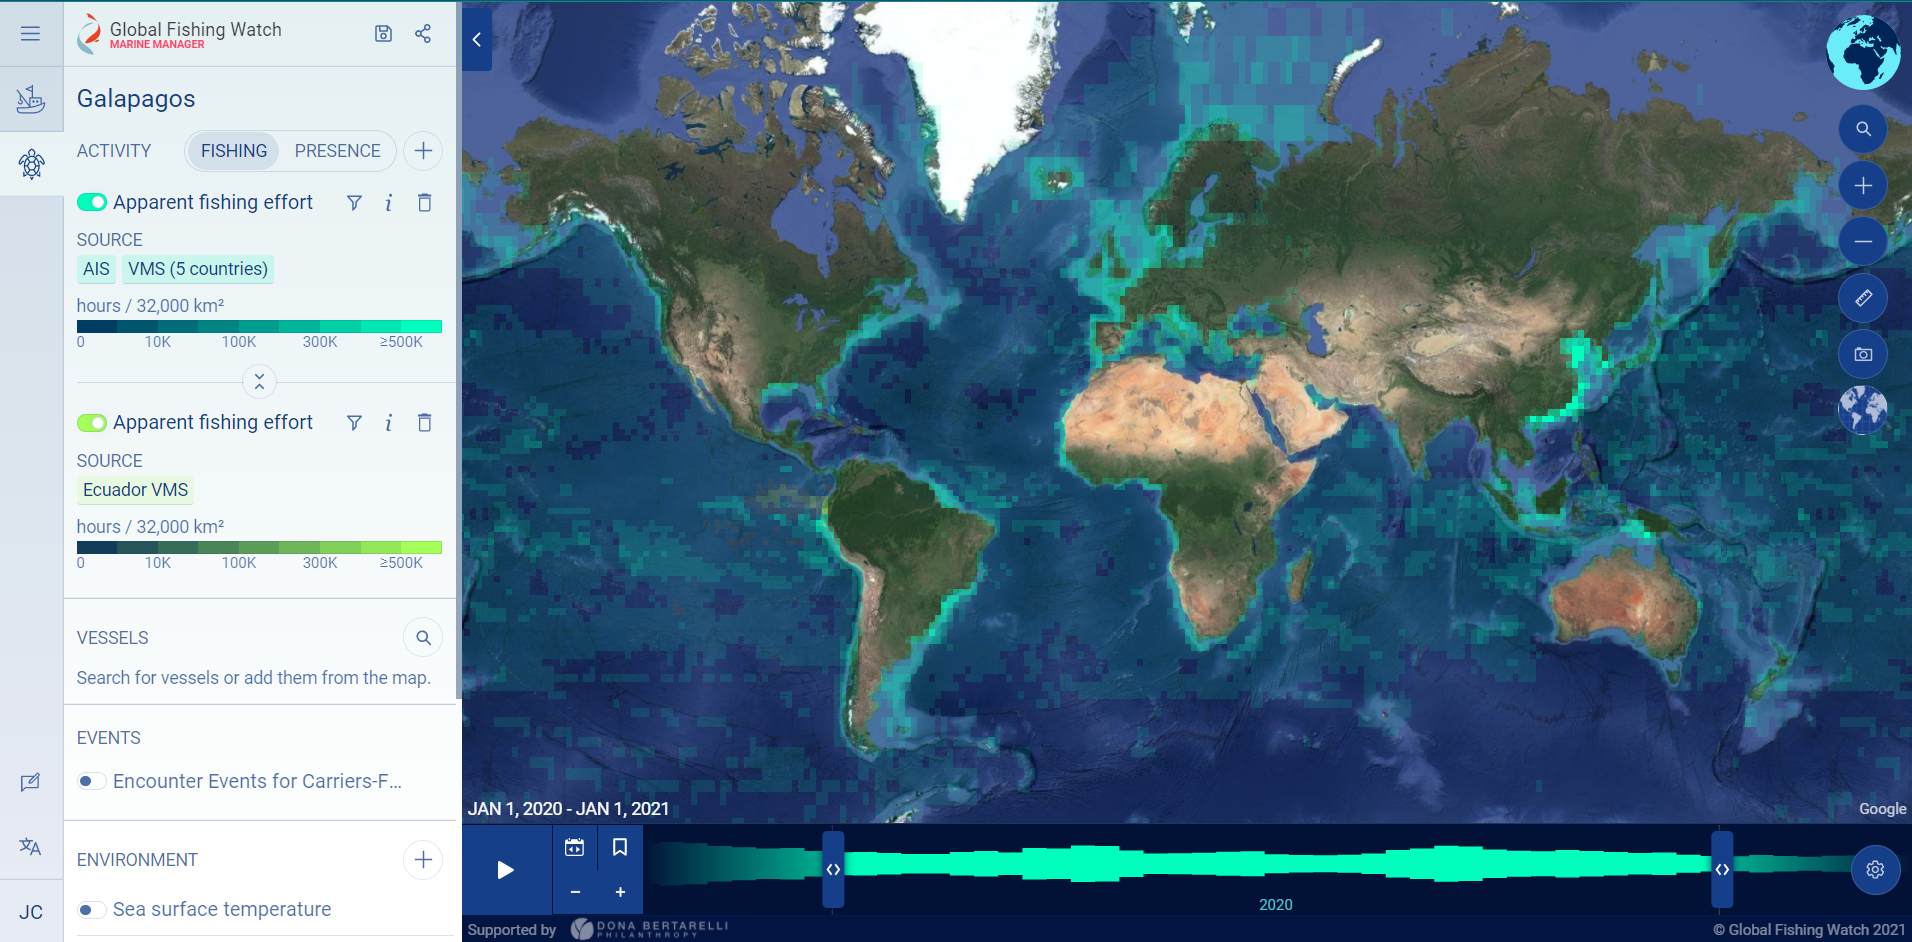
Global Fishing Watch and their partners also provide an interactive vessel map that allows users to interact with vessel activity across the globe, filter by country, and overlay port locations on coastlines.
Data Cleaning and Wrangling
Global Fishing Watch’s data includes fishing effort and vessel information from 167 countries over the years 2012-2020 (3). First, we select our variables of interest, group by country, and take the fishing effort means per year.
Our goal is to run a linear regression on each country’s fishing
effort over multiple years, but many countries have NA data
for certain years. Considering that we have data available for
2012-2020, we can subset these years for the model. We want to minimize
the amount of NA values because we will drop all
NA rows, and we want to maintain the maximum amount of rows
possible (which represent vessels and countries). We want to select a
chunk of continuous years leading up to 2020 with minimal data gaps. In
order to choose the start year for the time period that we will feed
into the linear regression, take a look at the amount of NA
values in the years leading up to 2020. It turns out that 2017, 2018,
and 2019 have the least amount of NA values, so we will use
2017 to start our 3-year data period to feed to the linear regression.
Next, we convert the data into Tidy format using the
pivot_longer() function so we can run a time series linear
regression analysis.
Our dates are in years, and currently their class is
character from the original dataset. We need these years in
date format in order to run a linear regression over time.
We will convert these years and remove all countries that only have data
for only one or two years, because we need multiple years of data to
feed into the regression and we want each country to have equal amounts
of data and start in the year 2017.
Linear Regression
Now that the data is sufficiently clean and our years are of class
date, we can run a time series linear regression on every
country’s fishing effort from 2017-2019 and use the output coefficients
to glean which direction each country is trending, meaning if the
country is fishing more or less over time. We can do this with the
do() function, grouping by country. Then we can feed this
output into a for loop! Plug in each country’s fishing effort intercept
and slope coefficients into a linear equation to predict the fishing
effort in 2020 based on that country’s historical trend. Subsequently,
we can combine the predicted 2020 fishing effort data with the actual
2020 fishing effort data into a single dataframe to compare by country.
We can make a new column that takes the difference of the actual and
predicted values, and then add a column that explicitly states whether
that country increased or decreased their fishing effort in 2020
relative to their trend leading up to 2020.
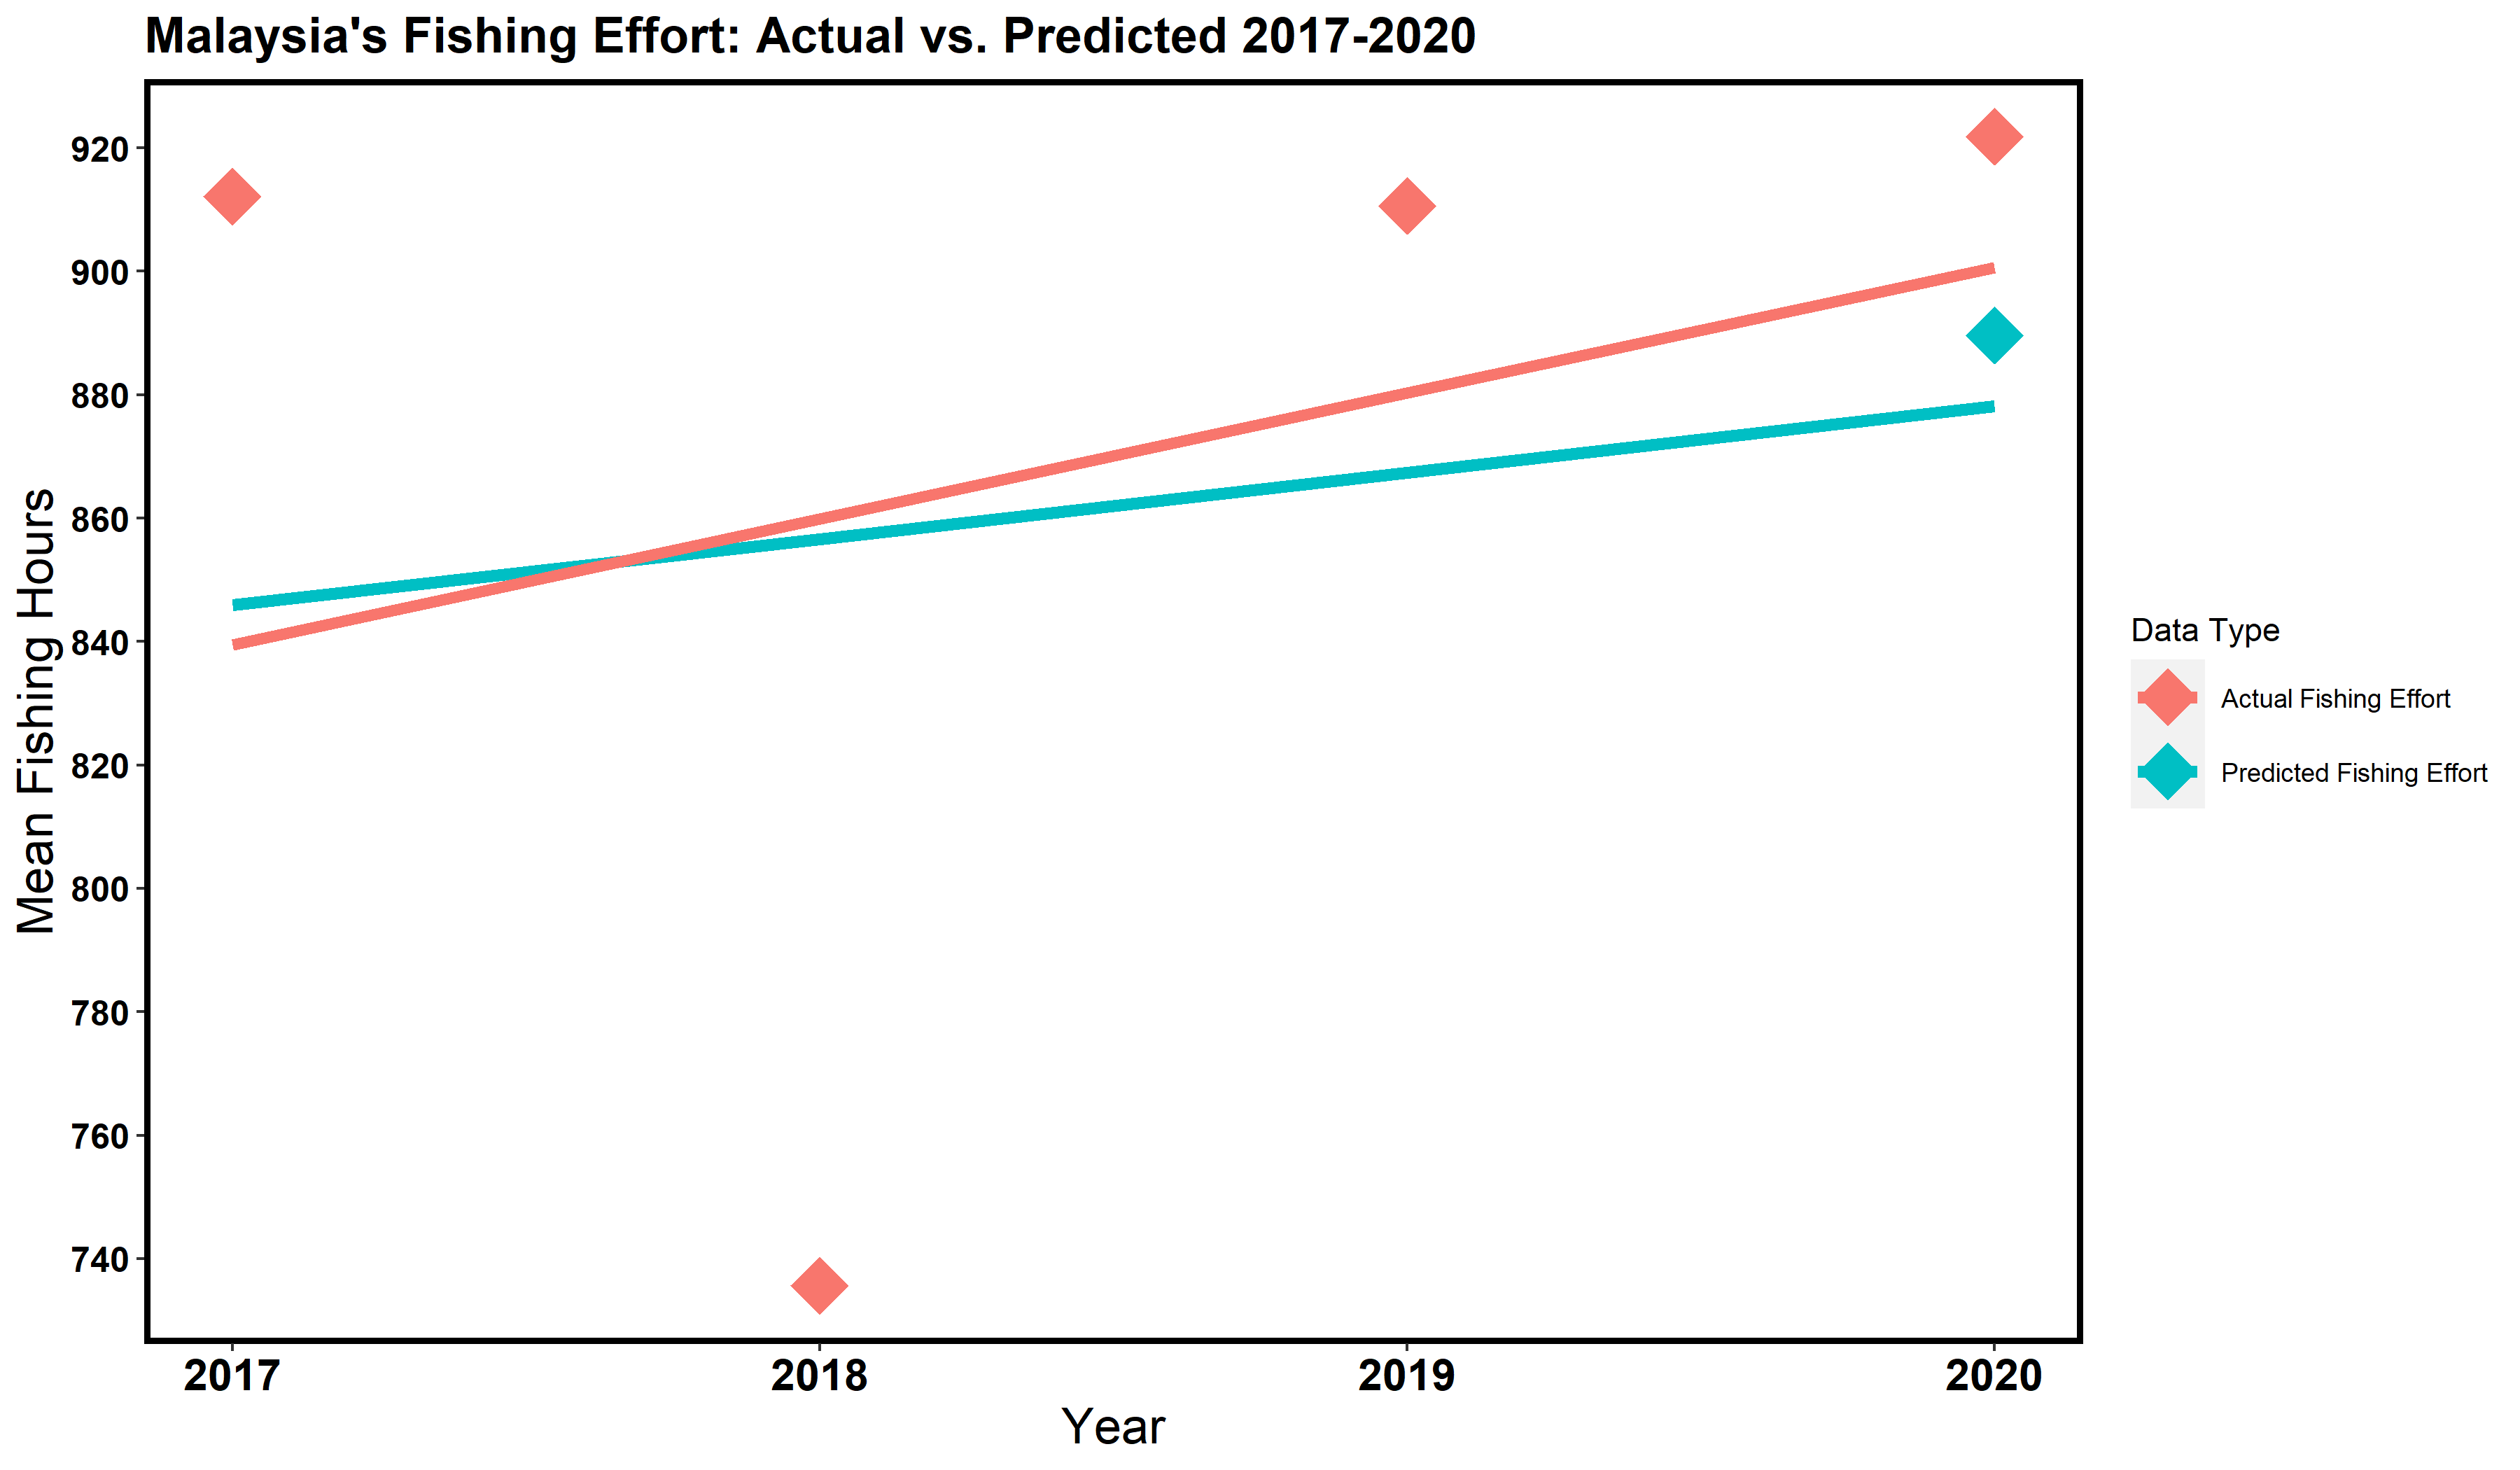
Plotting Actual Fishing Effort versus Predicted Fishing Effort for Malaysia
What does a single country’s fishing trend look like? Let’s consider the country of Malaysia in Southeast Asia. In 2015, Malaysia’s fisheries sector employed 175,980 people and its contribution to national gross domestic product was 1.1%. The fish trade is valued at $1.7 billion (U.S. dollars), and the estimated average consumption of fish is 56.8 kg/person/year. Malaysian fisheries primarily capture shrimp, squid, and fish. Malaysia contributes to the global fish economy through both importing and exporting fish (6).
We can make a country-specific fishing effort plot by filtering our
combined actual and predicted fishing effort dataframe to just
that country and using ggplot().
Statistical Significance
It’s time to run a t-test to determine if there is a statistical difference between the countries’ predicted fishing effort in 2020 and their actual fishing effort in 2020. A t-test is a handy tool in statistics that reveals how significant the differences between groups are. If the difference between the means of two groups could have easily happened by chance, the p-value will be greater than 0.05 (which is the standard threshold in statistics and environmental data science). If it is highly unlikely (less than a 5% chance) that a difference in means at least this extreme could have occurred by chance, the p-value is less than 0.05 and the results are considered statistically significant. A statistically significant outcome allows us to reject our null hypothesis.
Null Hypothesis: There is no difference between the predicted country-specific predicted fishing effort in 2020 and the actual country-specific fishing effort in 2020. \[H_{0}: \mu_{predicted} - \mu_{actual} = 0\] Alternative Hypothesis: There is a difference between the predicted country-specific predicted fishing effort in 2020 and the actual country-specific fishing effort in 2020. Because of the pandemic in 2020, I predict that fishing effort decreased, meaning that the actual country-specific fishing effort is less than the predicted country-specific fishing effort. \[H_{A}: \mu_{predicted} - \mu_{actual} \neq 0\]
Don’t forget to convert the data to Tidy format so we can run the t-test!
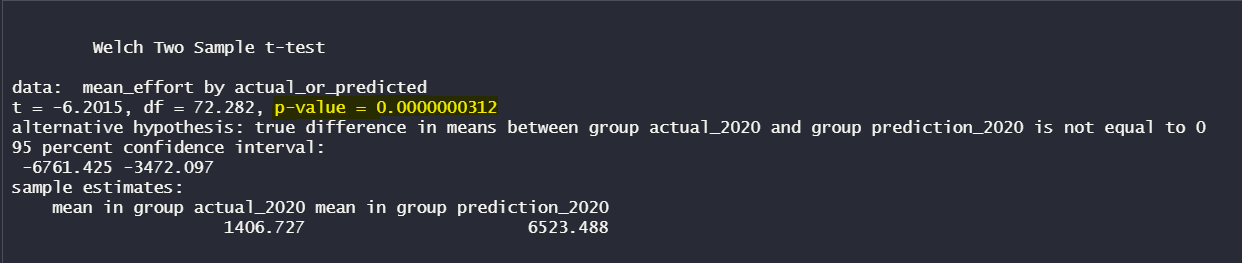
The p-value is 0.0000000312, and 0.0000000312 < 0.05, so we can reject our null hypothesis that there is no difference between the predicted country-specific predicted fishing effort in 2020 and the actual country-specific fishing effort in 2020. Many countries clearly changed their fishing effort in 2020 relative to their historical trend!
Summary: Which countries increased their fishing effort during the pandemic, relative to their trend leading up to 2020?
To best visualize this fishing effort data in a table, we can color code the countries that increased their fishing effort as red and color the countries that decreased their fishing effort in green. We can represent this data both on a map as well as a table.
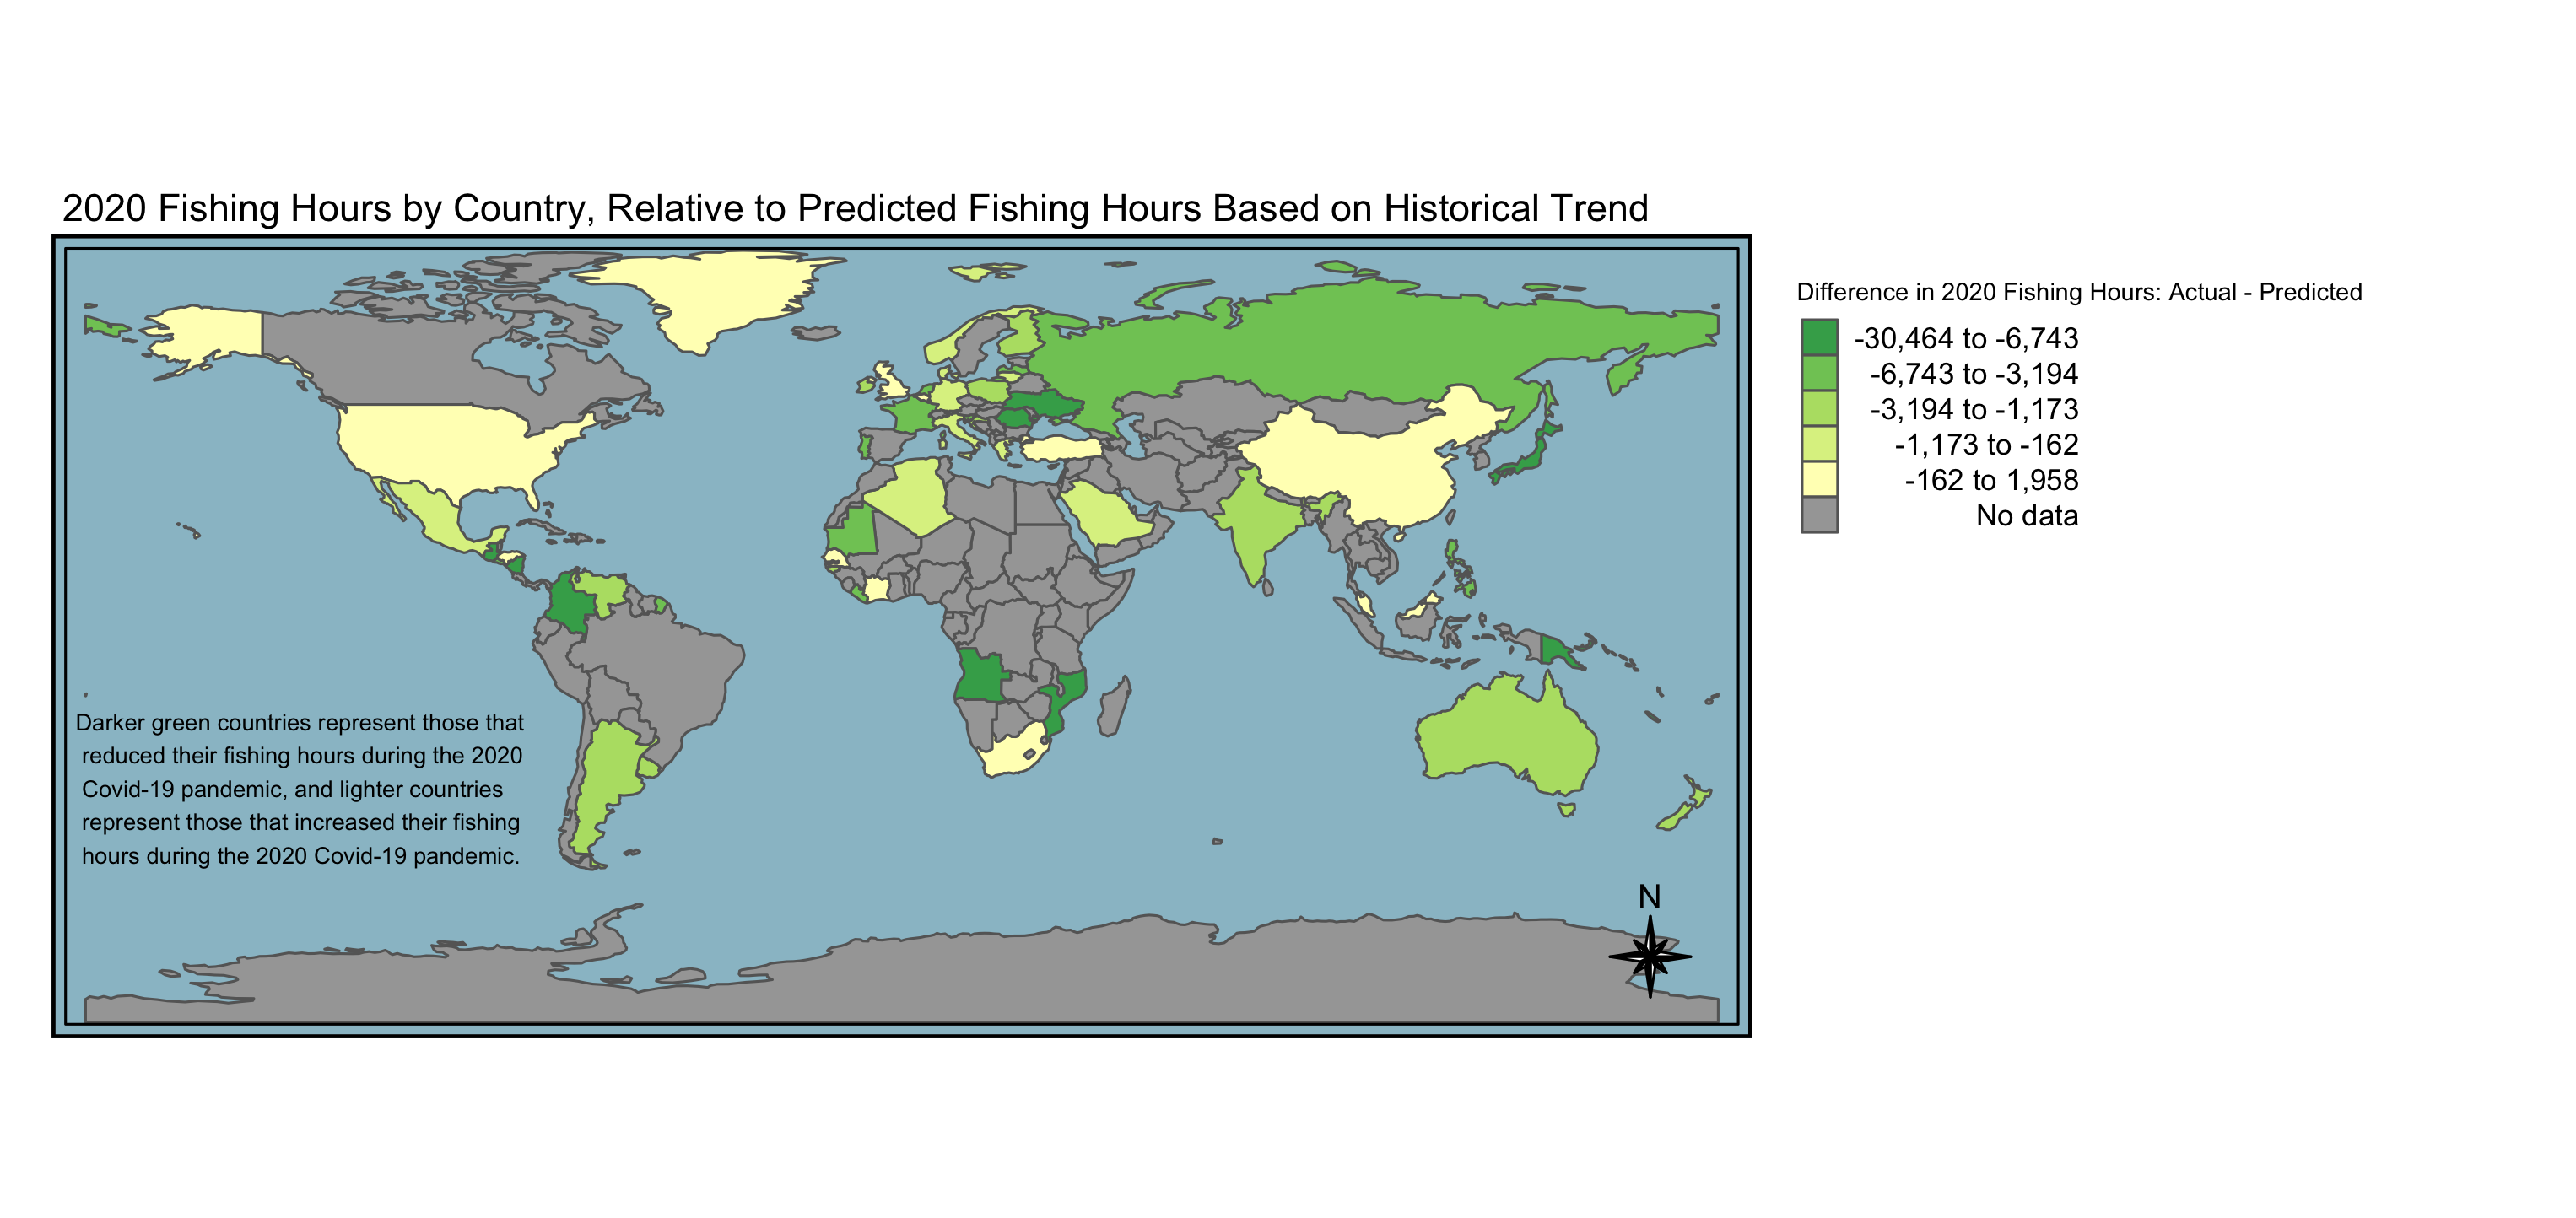
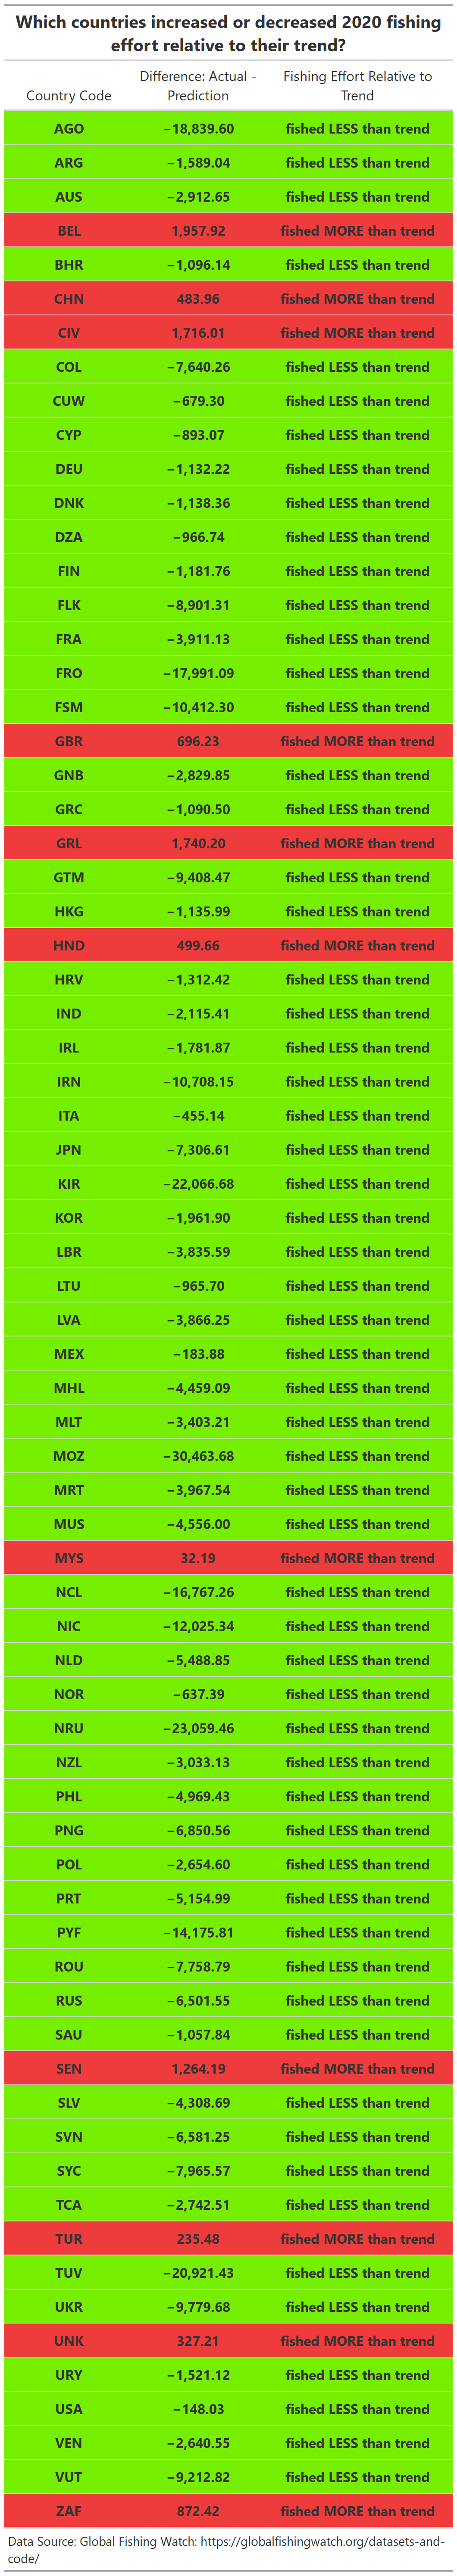
This color-coded table reveals that 85% of the countries included in this analysis decreased their fishing effort during the Covid-19 pandemic in 2020 relative to their fishing trend leading up to 2020, while 15% of the countries included in this analysis increased their fishing effort. The vast majority of countries’ fishing sectors seemed to follow the same stay-at-home order that was enforced across the globe. While this may have had a detrimental impact on the global fish economy, hopefully the marine fish populations we able to recover and thrive during this period of reprieve from human predation. The results of my statistical analysis match the conclusion of a 2021 scientific study investigating the change in marine recreational fishing activity during the first year of the pandemic (5).
Future Steps
In order to improve this analysis in the future, I recommend using more than three years of fishing effort data to produce a more accurate linear model. Additionally, I would recommend using a different statistical approach instead of iterating a for loop over each country’s fishing effort data, because this method produced outliers and coefficients that did not line up with observed fishing effort data. Lastly, I recommend running this analysis on fishing effort data from other sources in addition to Global Fishing Watch’s data. This will provide certainty that the data is accurate and the results are reproducible.
Thank you for reading my statistical review of global fishing effort during the 2020 Covid-19 pandemic! I hope I have inspired you to run your own time series analysis, t-tests, and create visualizations that help communicate trends in environmental data science. Please feel free to contact me at jscohen@ucsb.edu with any questions, comments, or suggestions. You may also create issues or pull requests for this analysis through GitHub (repository linked below).
Data Availability
The data used in this analysis is openly available, but the user must
make a free account on the Global Fishing watch website, which can be
accessed through this live link:
Global
Fishing Watch Datasets and Code
GitHub Repository Live Link
julietcohen’s GitHub Repository
Acknowledgements:
- I would like to acknowledge Dr. Tamma Carleton, my professor in
Statistics for Environmental Data Science at the U.C. Santa Barbara Bren
School for Environmental Science and Management, for all her support
throughout this project and this quarter.
- I would also like to thank my peers in the Master of Environmental
Data Science Program for being so open to collaboration and supporting
each other with resources, programming tools, and open-source
science.
- Lastly, I would like to thank Global Fishing Watch for inspiring me to give a hoot about global fishing effort by country, and for providing the data that made this project possible.
Resources (live links):
- Interactive
World Map of Fishing Activity: Picture 1 and Map Link 1 - Global Fishing
Watch
- Interactive
World Map of Fishing by Country: Map Link 2 - Global Fishing
Watch
- Global
Fishing Watch: Datasets and Code, Fishing effort data
note: Users must make a free account in order to access datasets
- Global
Fishing Effort (1950–2010): Trends, Gaps, and Implications.
Anticamara, J. A., R. Watson, A. Gelchu, and D. Pauly. “Global Fishing Effort (1950–2010): Trends, Gaps, and Implications.” Fisheries Research 107, no. 1 (2011): 131–36. https://doi.org/10.1016/j.fishres.2010.10.016.\ - First
Assessment of the Impacts of the COVID-19 Pandemic on Global Marine
Recreational Fisheries.:
Pita, Pablo, Gillian B. Ainsworth, Bernardino Alba, Antônio B. Anderson, Manel Antelo, Josep Alós, Iñaki Artetxe, et al. “First Assessment of the Impacts of the COVID-19 Pandemic on Global Marine Recreational Fisheries.” Frontiers in Marine Science 8 (2021): 1533. https://doi.org/10.3389/fmars.2021.735741.\ - Malaysia’s
Fisheries Economy
- Google
Maps: Malaysia
- Wikipedia: Top Marine Fisheries Species Captured
- Global Fishing Watch - About Us
Distill is a publication format for scientific and technical writing, native to the web.
Learn more about using Distill at https://rstudio.github.io/distill.